Appearance
Using multiple components
As mentioned in the ‘Limitations / workarounds’ section, if you wish to add more than one component type to the same report, you will need to configure another ‘instance’ of the ART connector. In order to do this:
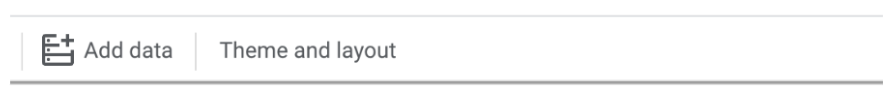
Click on the ‘add data’ button in the toolbar
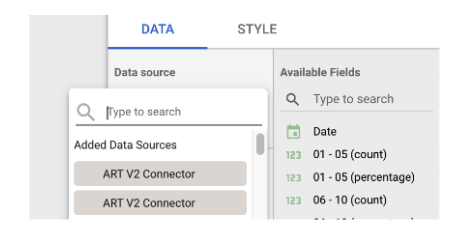
When the connector list opens up, select the ‘ART V2 Connector’

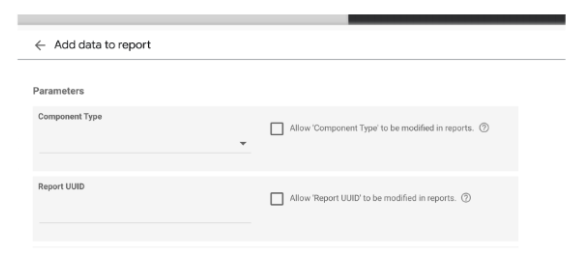
You will then need to configure the connector almost identically as you did before, with the exception being the parameters that related to the new component type you wish you use.
Once you have completed this section, you will be taken back to your report canvas. When adding a new chart to your report, you will be able to select which datasource that specific chart uses on the right sidebar under the ‘DATA’ section. Unfortunately, your data sources will have the same name (and there is no way to rename this). But they will be ordered in descending order, with the one added most recent being at the very top.
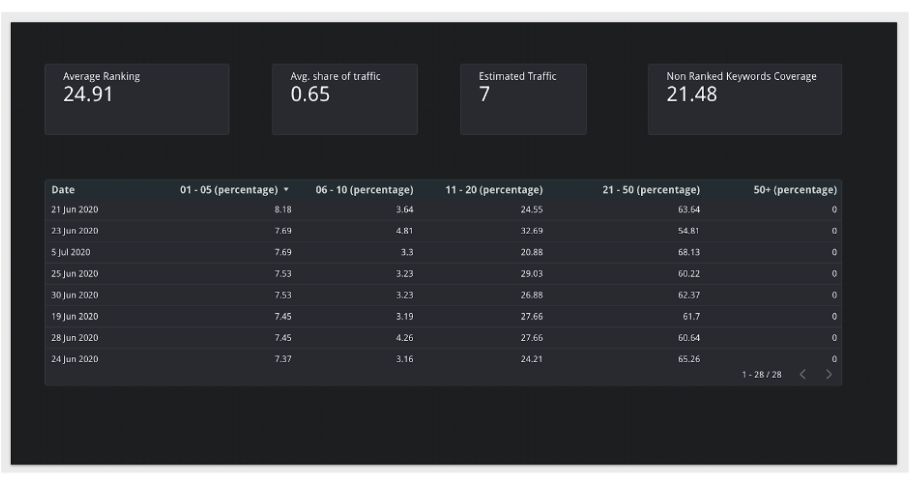
An example report using the stats component and distribution component together.